February 2026 – Executive Summary
Surrey, BC | Commercial Rental Market Outlook
Market Overview by Performance Property Management
Surrey, BC enters February 2026 as Metro Vancouver’s most dynamic suburban commercial market. Driven by strong population growth, expanding post-secondary infrastructure, and the delivery of the Health & Technology District’s centrepiece — City Centre 4 — Surrey recorded 361,000 sq. ft. of net office absorption in 2025, the highest of any suburban submarket in the region.
Industrial vacancy has risen from historically near-zero levels to approximately 3.0% in Surrey, reflecting a broader Metro Vancouver supply correction that appears to be approaching its peak. Retail vacancy remains among the tightest in the region at 2–4% for neighbourhood and strip formats, though the Hudson’s Bay Company anchor void at Central City and the arrival of new City Centre 4 retail supply in 2026 warrant close monitoring.
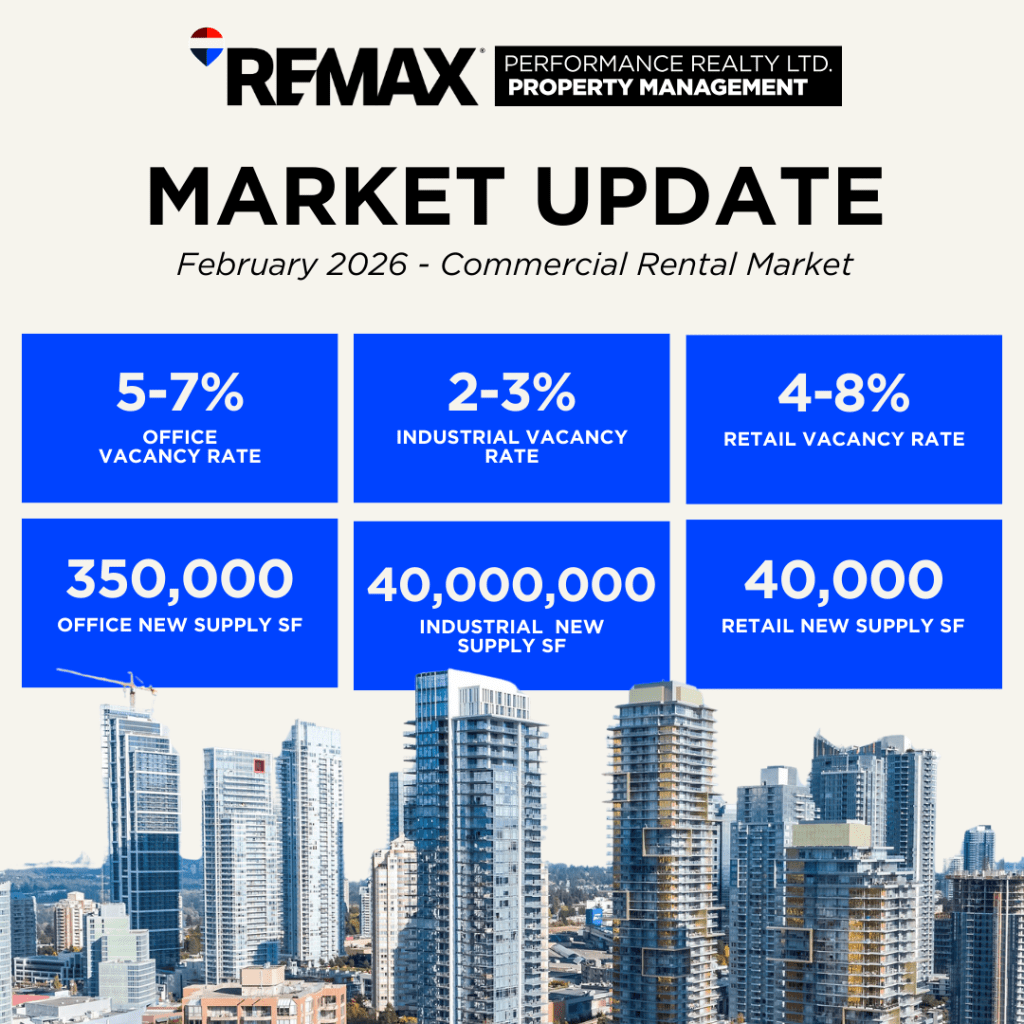
| 361,000 sfOffice Net Absorption (2025)Surrey led all Metro Van. suburbs (Newmark Q4 2025) | ~3.0%Industrial Vacancy — SurreyBelow Metro Van. avg of 4.3% (C&W Q3 2025) | 2–4%Retail Vacancy — Strip/NbhdTight across non-mall formats (CBRE 2025) | ~4.0M sfUnder Construction — IndustrialMetro Van. multi-year low (Q2 2025) |
OFFICE MARKET
ASurrey’s office market has been the standout performer across Metro Vancouver’s suburban landscape throughout 2024–2025. The Health & Technology District in City Centre — anchored by Surrey Memorial Hospital, SFU Surrey, and a planned UBC campus — continues to attract institutional, academic, health and professional services tenants. No meaningful new office supply is anticipated beyond the recently delivered City Centre 4 (CC4), with all planned projects paused across Metro Vancouver (CBRE, 2026 Outlook).
Class AAA — Health & Technology District
Class AAA office in Surrey is concentrated in the Health & Technology District, anchored by the newly delivered City Centre 4 — the largest and most significant phase of this master-planned precinct. CC4 targets LEED Gold certification and represents Surrey’s only true AAA submarket. It commands a material premium over Class A and AA product and competes directly with downtown Vancouver’s top-tier buildings on amenity and quality.
| METRIC | VALUE | NOTES & SOURCES |
| Total Inventory | ~500,000 sf | Health & Technology District — City Centre 4 (CC4) plus earlier phases (Altus Group Q3 2025) |
| New Supply | ~350,000 sf (2025) | City Centre 4 delivered Q4 2025, LEED Gold target; Altus Group Q3 2025 |
| Vacancy Rate | ~5–7% | Estimated; CC4 partially pre-leased at delivery. No Surrey-specific AAA vacancy published independently |
| Net Asking Rate | $40–$48 psf/yr | Broker estimate — no public listed rate available for CC4. Verify directly with Nicola Institutional Realty Advisors |
| Additional Rent | $18–$22 psf/yr | Estimated based on LEED-certified building operating costs; Metro Vancouver suburban norms |
| Total Rent | $58–$70 psf/yr | Net + Additional Rent (estimated all-in occupancy cost) |
| Demand Profile | Health · Tech · Academic · Gov’t | SFU Surrey, UBC (planned campus), Surrey Memorial Hospital, medtech, professional services |
Class AA — City Centre Premium
Class AA properties occupy established premium towers in Surrey City Centre, led by Central City Tower (25 storeys, BOMA BEST Gold). These assets benefit directly from the Health & Technology District halo and SkyTrain adjacency. While some large-block sublease space has come to market as tenants right-size, overall absorption in the City Centre node remains positive.
| METRIC | VALUE | NOTES & SOURCES |
| Total Inventory | ~1.2–1.5M sf (est.) | City Centre towers and premium suburban; no single published Surrey AA inventory figure |
| New Supply | Nil (2025–2026) | No new AA deliveries anticipated; all speculative office paused (CBRE Vancouver Outlook 2026) |
| Vacancy Rate | ~8–11% | Tracking Metro Vancouver suburban Class A average; Newmark Q4 2025 / Avison Young Q3 2025 |
| Net Asking Rate | $32–$40 psf/yr | UrbanTeam & CommercialSearch 2024–2025; Central City Tower (BOMA BEST Gold) as benchmark asset |
| Additional Rent | $16–$20 psf/yr | Estimated from Metro Vancouver suburban operating cost norms |
| Total Rent | $48–$60 psf/yr | Competitive versus Downtown Vancouver all-in cost of $50–$65+ psf |
| Demand Profile | Professional services · Finance · Gov’t | Strong absorption in 2025; Surrey led Metro Vancouver suburban market (Newmark Q4 2025 — 361,000 sf net absorption) |
Class A — Suburban Business Parks
Class A suburban parks — concentrated in Newton, Cloverdale, and along the 96 Avenue corridor — represent the highest volume of Surrey office transactions by count. These assets attract professional services, medical back-office and government users, and benefit from materially lower rents and ample free parking relative to City Centre. Older product in this tier faces ongoing pressure from hybrid work patterns and the relative affordability of upgrading to Class AA.
| METRIC | VALUE | NOTES & SOURCES |
| Total Inventory | ~3–4M sf (est.) | Newton, Cloverdale, 96 Ave business parks, South Surrey; estimated from municipal data |
| New Supply | Nil (2025–2026) | No speculative Class A suburban groundbreakings (CBRE Q4 2025); landlords on hold |
| Vacancy Rate | ~10–14% | Higher than City Centre; older product challenged by hybrid work. Availability rate ~14–17% incl. sublease |
| Net Asking Rate | $22–$32 psf/yr | Live LoopNet listings (Feb 2026): $18.64 psf (Campbell Heights) · $24.00 psf (King George) · $36.00 psf (Scott Rd) |
| Additional Rent | $12–$16 psf/yr | Lower OpEx than City Centre towers; ample surface parking typical |
| Total Rent | $34–$48 psf/yr | Strong value versus Burnaby and Richmond Class A ($45–$55+ psf gross) |
| Demand Profile | Medical · Professional services · Back-office | Hybrid work supporting suburban consolidation; SME and health-sector tenants most active |
INDUSTRIAL MARKET
Surrey’s industrial market — centred in Campbell Heights, Newton, Port Kells and Colebrook — has transitioned from near-zero vacancy (2021–2022) through a supply-correction phase as Metro Vancouver’s speculative construction cycle outpaced near-term demand. As of Q4 2025, Surrey’s vacancy sits at approximately 3.0% — below the Metro Vancouver average of 4.3% (Cushman & Wakefield Q3 2025) — reflecting Surrey’s structural advantages: South Fraser Perimeter Road access, proximity to Highway 1, Highway 99 and the US border crossing at Pacific Highway, and the scale and quality of Campbell Heights Business Park.
The under-construction pipeline has declined to approximately 4.0 million sq. ft. across Metro Vancouver as of Q2 2025 — its lowest level since 2020 — with developer appetite for new groundbreakings constrained by elevated construction costs and occupier caution. Large-format demand is recovering strongly, with CBRE reporting 12 spaces over 100,000 sf across the region with offers in place or under contract by end of 2025.
| METRIC | VALUE | NOTES & SOURCES |
| ── LARGE FORMAT LOGISTICS (100,000+ sf) | ||
| Total Inventory | ~25M sf (Metro Van.) | Surrey share: Campbell Heights + Port Kells + Colebrook nodes (CBRE Industrial Q4 2025) |
| New Supply | ~4.0M sf under constr. | Metro Vancouver pipeline — lowest since 2020 (Q2 2025); developer caution on new starts |
| Vacancy Rate | ~2–3% (Surrey) | Surrey below Metro Van. average of 4.3% (C&W Q3 2025); Newmark cited Surrey at ~3.0% (Q4 2025) |
| Net Asking Rate | $19–$22 psf/yr | Live listing: 15030 54A Ave (CBRE, 136,268 sf) at $19.00 psf (Jan 2026). Avison Young avg $20.26 psf (Q3 2025) |
| Additional Rent | $6–$8 psf/yr | Standard Metro Vancouver industrial TMI range (Avison Young / C&W Q3 2025) |
| Total Rent | $25–$30 psf/yr | All-in occupancy cost; declined from 2022 peak of ~$31 psf |
| Demand Profile | 3PL · Distribution · E-commerce | 12 large-format blocks Metro Van. with offers/under contract end-2025 — supply could halve by Q2 2026 (CBRE) |
| ── MID-BAY (20,000–100,000 sf) | ||
| Total Inventory | Significant (est.) | Newton, Port Kells, Cloverdale — no single published mid-bay inventory count for Surrey |
| New Supply | Moderate (2024–2025) | Some mid-bay delivered with speculative cycle; now slowing |
| Vacancy Rate | ~3–4% | Estimated from Surrey submarket and comparable Metro Van. nodes |
| Net Asking Rate | $17–$20 psf/yr | Live listings: 13018 80 Ave at $19.50 psf (Jan 2026) · Cedar Coast South Surrey at $18.00 psf (Feb 2026) |
| Additional Rent | $6–$8 psf/yr | Consistent with large-format TMI; minor variation by property age |
| Total Rent | $23–$28 psf/yr | Moderate inducements (free rent, TI) available on longer-term deals |
| Demand Profile | Light manufacturing · Warehousing · Distribution | Selective demand; tenants evaluating options amid tariff uncertainty |
| ── SMALL BAY (<20,000 sf) | ||
| Total Inventory | Widespread | Distributed across all Surrey industrial nodes; strata and leasehold product |
| New Supply | Limited | New small-bay strata construction constrained by land costs |
| Vacancy Rate | ~4–6% | Softest segment; SME tenant caution most pronounced here |
| Net Asking Rate | $14–$18 psf/yr | Live listings: 19135 94th Ave at $15.95 psf (Oct 2025) · 13365 115th Ave at $19.95 psf (Feb 2026) |
| Additional Rent | $5–$7 psf/yr | Slightly lower than larger formats due to older building stock |
| Total Rent | $19–$25 psf/yr | Landlords offering free rent and flexible terms to attract tenants |
| Demand Profile | SME · Trades · Service businesses | Hold pattern among small occupiers; recovery expected as BoC rate cuts flow through |
RETAIL MARKET
Surrey’s retail market is structurally well-supported, with vacancy across neighbourhood, strip and community centre formats running between 2–4% (CBRE, 2025). The market is entering an important supply transition in 2026, with City Centre 4 delivering approximately 40,000 sq. ft. of new retail space and the Hudson’s Bay Company anchor void at Central City remaining unresolved. Neighbourhood and suburban strip formats continue to outperform, underpinned by Surrey’s population growth, diverse consumer base and limited new construction.
Institutional landlords are seeking annual escalations of 2–4% on new leases (CBRE Retail Rent Survey H1 2025). The Scott Road corridor and South Surrey nodes remain among the most consistently occupied retail streets in Metro Vancouver.
| METRIC | VALUE | NOTES & SOURCES |
| ── CITY CENTRE / MIXED-USE PODIUM | ||
| Total Inventory | ~1.5M sf (est.) | City Centre core and mixed-use nodes; includes Central City, emerging CC4 podium |
| New Supply | ~40,000 sf (2026) | City Centre 4 retail podium delivery 2026 — primary new supply event for Surrey (CBRE 2026 Outlook) |
| Vacancy Rate | ~4–8% | Elevated vs. strip formats; HBC anchor vacancy at Central City adds uncertainty. Ongoing risk watch |
| Net Asking Rate | $28–$42 psf/yr | Estimated from LoopNet.com USD listings converted at ~1.40 FX; no live CAD listed rate for CC4 retail |
| Additional Rent | $14–$18 psf/yr | Higher OpEx in mixed-use podium vs. strip (HVAC, common area maintenance) |
| Total Rent | $42–$60 psf/yr | Range reflects new vs. older mixed-use stock; CC4 podium at upper end |
| Demand Profile | Health · Wellness · F&B · Services | Institutional anchors; medical and food-service tenants most active; HBC void remains key risk |
| ── SOUTH SURREY / WHITE ROCK (PREMIUM) | ||
| Total Inventory | ~800,000 sf (est.) | Morgan Crossing, Semiahmoo, White Rock Square and corridor retail; premium suburban node |
| New Supply | Minimal | Very limited new strip development; land costs prohibitive |
| Vacancy Rate | ~1–3% | Tightest Surrey retail node; affluent demographics support strong occupancy |
| Net Asking Rate | $25–$40 psf/yr | Live listing: White Rock Square at $25.00 psf (Jul 2025) · Redwood Square (King George) at $42–$45 psf (Aug 2025) |
| Additional Rent | $12–$16 psf/yr | Institutional landlord (First Capital REIT, Re/Max) standard TMI |
| Total Rent | $37–$56 psf/yr | Premium positioning reflects strong household incomes and low churn |
| Demand Profile | Specialty retail · F&B · Medical · Wellness | High-income demographic drives demand; national tenants and lifestyle brands preferred |
| ── NEIGHBOURHOOD / COMMUNITY STRIP | ||
| Total Inventory | ~3–4M sf (est.) | Widespread across Newton, Whalley, Cloverdale, Guildford and corridor strip centres |
| New Supply | Minimal | Negligible new strip construction given land and construction cost environment |
| Vacancy Rate | ~2–4% | CBRE 2025 Retail Outlook; tight across most Surrey neighbourhood formats |
| Net Asking Rate | $18–$28 psf/yr | Live listings: Whalley Blvd at $12.00 psf (Nov 2025) · CommercialCafe 99-property avg $27.23 gross psf |
| Additional Rent | $10–$14 psf/yr | Older strip centres carry lower operating costs than newer mixed-use |
| Total Rent | $28–$42 psf/yr | Strong value relative to South Surrey premium and City Centre formats |
| Demand Profile | Grocery · Discount · F&B · Personal services | Population growth and diverse demographics (Scott Rd South Asian retail node) underpin sustained demand |
EXTERNAL MARKET FACTORS
The following Political, Economic, Environmental, Social, Technological and Legal (PEESTL) factors are shaping the Surrey commercial leasing environment as of February 2026 across all three asset classes.
| POLITICAL | US–Canada tariff tensions (25% on steel, aluminum and selected goods) creating business uncertainty — dampening occupier expansion decisions across industrial and office sectorsFederal election year: housing and affordability policy shifts may affect mixed-use zoning and commercial intensification timelines in Surrey City CentreSurrey–Langley SkyTrain extension approvals proceeding; City of Surrey’s pro-growth Official Community Plan remains supportive of commercial developmentReduced federal immigration targets (2025–2027) will moderate population-driven commercial demand growth over the medium term |
| ECONOMIC | Bank of Canada policy rate reduced to 2.25% (October 2025), easing borrowing costs and improving investment sentiment; further cuts anticipated into 2026BC GDP growth projected at approximately 1.1% in 2026 — modest but positive; employment recovering across lower mainlandConstruction costs remain structurally elevated, constraining new supply pipelines across office, industrial and retail asset classesTariff uncertainty causing occupier hesitation, particularly among SMEs in trade-dependent sectors; larger corporate tenants less affected |
| ENVIRONMENTAL | Flight-to-quality ESG requirements intensifying: institutional tenants increasingly demand LEED Gold and BOMA BEST certified buildingsCity Centre 4 targeting LEED Gold certification — setting a new sustainability benchmark for Surrey’s office marketOlder Class B and C buildings face rising operating expenditures from energy efficiency disclosure and compliance requirementsCampbell Heights industrial area constrained on three sides by Agricultural Land Reserve (ALR) boundaries, limiting future supply expansion |
| SOCIAL | Surrey’s population has surpassed 600,000, making it BC’s fastest-growing city and providing a deep labour pool and expanding consumer baseUBC Surrey campus (planned) and SFU Surrey creating a health-tech and academic cluster that is driving institutional office demand in City CentreReturn-to-office mandates from major employers and the federal government are contributing to positive suburban office absorption in 2025Diverse demographics — including large South Asian, Filipino and Southeast Asian communities — generate sustained demand for culturally specific retail formats along Scott Road and surrounding corridors |
| TECHNOLOGICAL | Surrey Memorial Hospital and the Health & Technology District are attracting a growing cluster of medtech, biotech and digital health occupiersFlexible and hybrid workspace norms continue to reshape office fit-out requirements; coworking operators are expanding their footprint in Surrey City CentreE-commerce demand normalization has reduced peak logistics requirements, though large-format, high-clearance industrial space remains actively soughtIndustrial tenants investing in automation are requiring higher clear-heights, increased power supply and modern mechanical specifications in new leases |
| LEGAL | Bill 44 (Provincial): upzoning mandates near SkyTrain stations are creating mixed-use and commercial redevelopment opportunities across Surrey’s transit corridorsCity of Surrey Official Community Plan supports commercial intensification and densification in City Centre and designated Urban CentresHudson’s Bay Company liquidation legal proceedings have created anchor-space uncertainty at Central City mall — resolution timeline and re-tenanting remain a key market watch itemBC Speculation and Vacancy Tax continues to influence commercial-adjacent mixed-use development sequencing and timelines in select nodes |
MARKET OUTLOOK
Office
Surrey City Centre is structurally positioned to continue outperforming Metro Vancouver’s suburban office market through 2026. The delivery of CC4, the expansion of SFU and UBC presence, and the ongoing return-to-office trend all support demand for AAA and AA product. No new supply is planned beyond CC4, meaning any incremental demand recovery will directly benefit existing landlords. Class A suburban parks face a longer recovery timeline and may require continued inducement packages to fill vacancies.
Industrial
Surrey industrial appears to be near peak vacancy in the current cycle at approximately 3.0%. With the construction pipeline at multi-year lows and large-format demand accelerating, vacancy is expected to tighten toward 2.0–2.5% by late 2026 — the threshold at which net rents historically resume upward pressure (Avison Young Q3 2025). Campbell Heights will remain the premier industrial node. Small-bay landlords should expect continued inducement requirements and longer deal timelines through mid-2026.
Retail
Non-mall retail in Surrey remains fundamentally healthy, supported by population growth and consumer spending resilience. The HBC void at Central City is the market’s single largest risk — its resolution will set confidence across regional mall formats broadly. City Centre 4’s retail podium will test demand from mixed-use anchor tenants in 2026. Food and beverage, health and wellness, and grocery-anchored formats will continue to lead leasing activity across all Surrey nodes.
| METRIC | VALUE | NOTES & SOURCES |
| ── ASSET CLASS OUTLOOK SUMMARY | ||
| Office AAA — H&T District | Tightening | Health/tech cluster expansion; UBC anchor arrival |
| Office AA — City Centre | Improving | Flight-to-quality demand; sublease overhang absorbing |
| Office A — Suburban Parks | Stable / Soft | Hybrid work headwinds; value positioning opportunity |
| Industrial — Large Format | Tightening | 3PL/logistics demand acceleration; pipeline low |
| Industrial — Mid & Small Bay | Stable | Gradual recovery as rate cuts flow through to SMEs |
| Retail — Neighbourhood/Strip | Stable | Population-driven demand; tight vacancy to persist |
| Retail — Regional Mall | At Risk / Watch | HBC void resolution timeline is key variable |
DATA SOURCES
This report draws on publicly available market data from: CBRE Canada (Q4 2025 Office Figures; Vancouver Outlook 2026; H1 2025 Retail Rent Survey); Avison Young (Metro Vancouver Office Q3 2025; Industrial Q3 2025); Newmark (Metro Vancouver Market Overview Q4 2025); Cushman & Wakefield (Industrial Q3 2025); Altus Group (Vancouver CRE Market Update Q3 2025); Morguard (2026 Canadian Economic Outlook); CMHC (Housing Market Outlook 2026); City of Surrey (Housing Needs Report 2025); LoopNet.ca active listings (verified February 24, 2026). Surrey-specific vacancy rates at the class level are not published as standalone datasets by any single brokerage; figures in this report are derived by triangulating Metro Vancouver suburban averages with Surrey-specific absorption and live listing data. Readers seeking transaction-level data are encouraged to consult a licensed brokerage active in the Surrey market.

